Project
Disease rates across Poland, every week
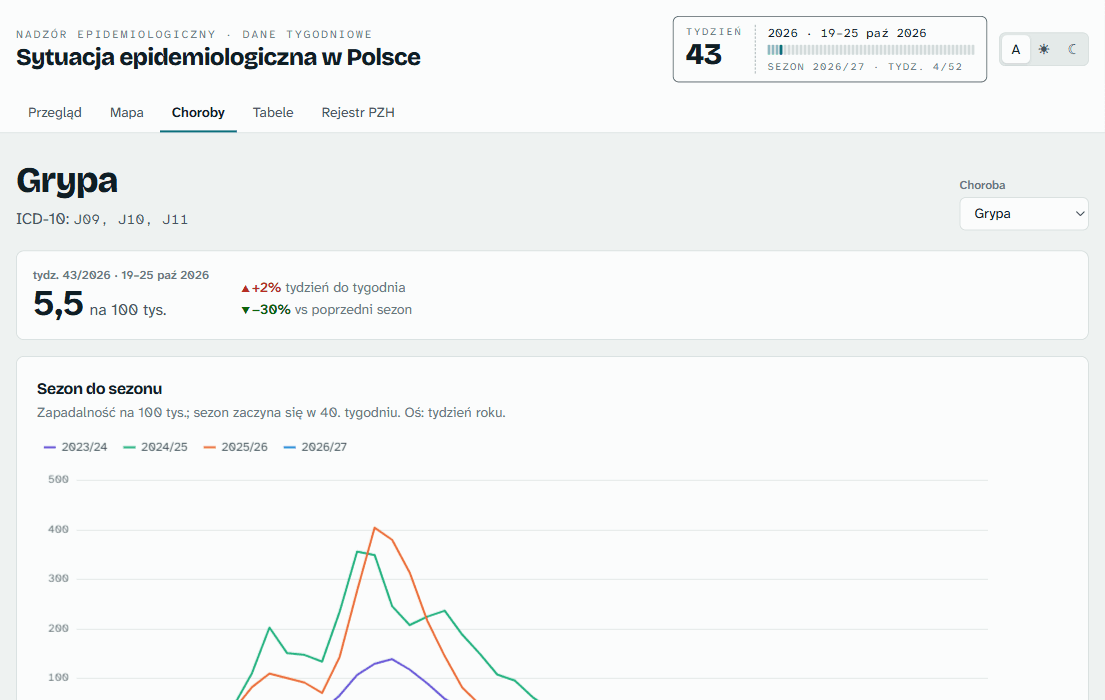
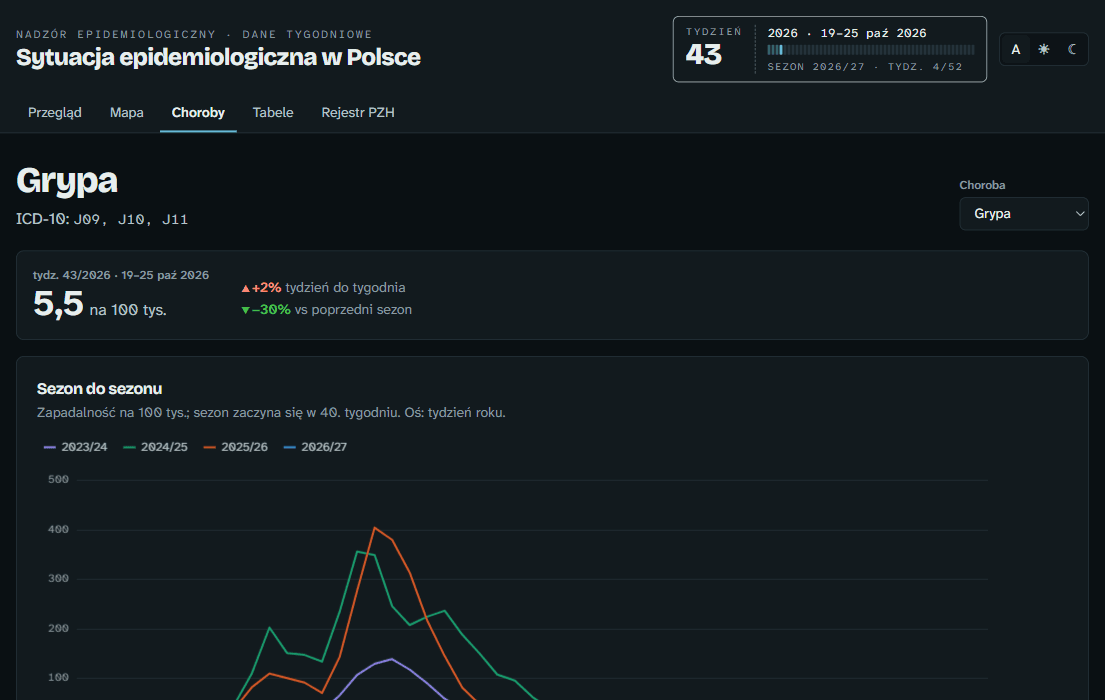
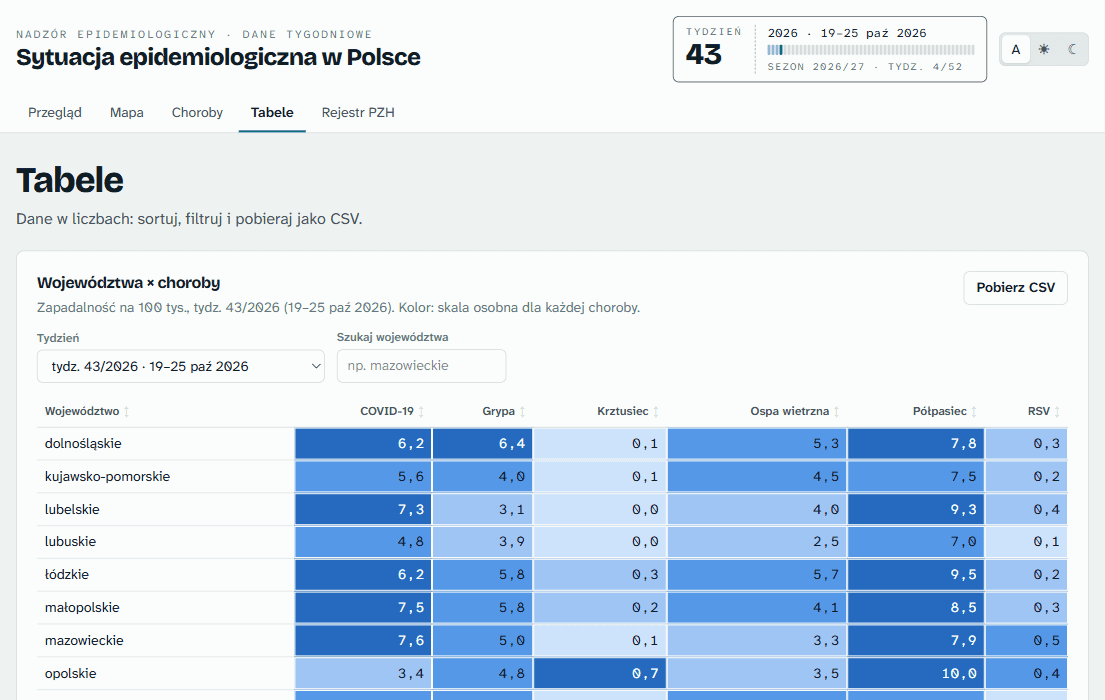
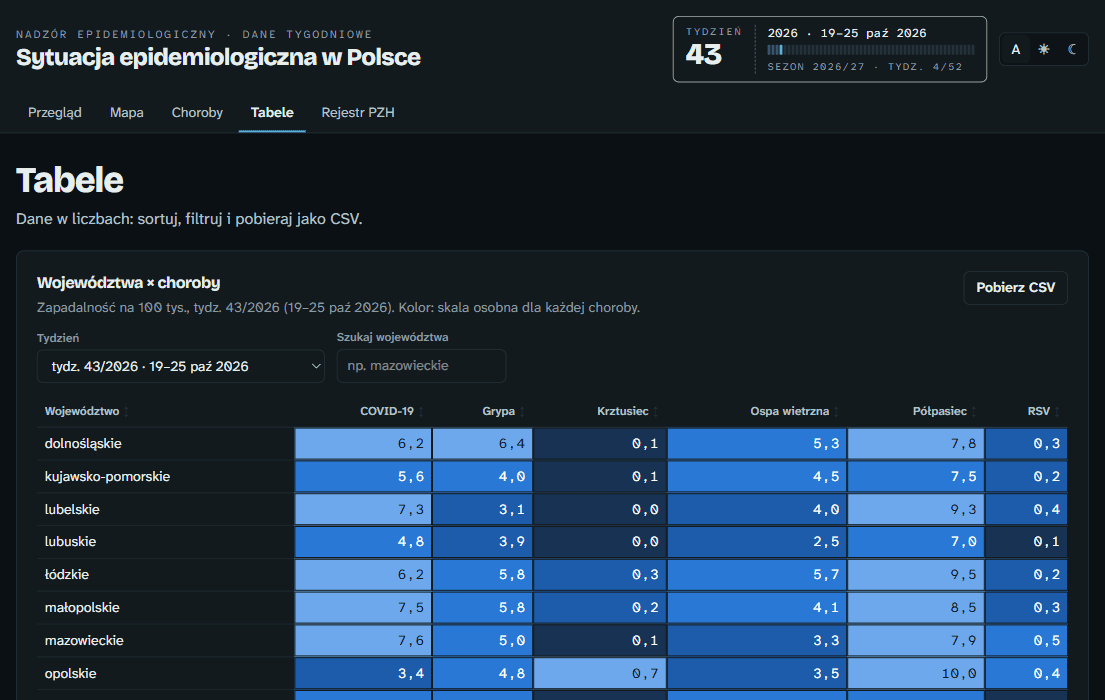
Epi Poland is a dashboard with a map, charts and tables. The interface is in Polish.
Why I built it
Infection data for Poland is spread across an e-health report, national bulletins, and European and WHO datasets. I wanted one place to see what is going around, by week and by region.
The data job
A weekly job downloads XLSX, CSV and PDF sources, parses them and validates every dataset before writing anything. It checks that series line up, all 16 voivodeships are present and periods have no gaps. The app itself never calls those sources, and a rerun on unchanged data writes nothing.
If WHO FluNet or the PZH bulletins fail, their previous output is kept. If another required source fails, the run exits with an error.
Reading the PDF bulletins
The national public health institute (NIZP PZH-PIB) publishes its bulletins as PDFs, so the parser reads text by position and takes the column ranges from each page's header.
The annual books from 1999 to 2025 all go through the same code. The full books draw Polish accents as separate glyphs, so headings are matched on an ASCII key and voivodeships by their number.
What the numbers are
Weekly rates come from P1 e-health records, not official notifiable-disease statistics. The PZH bulletins are notification data, so the app notes the difference on those pages.
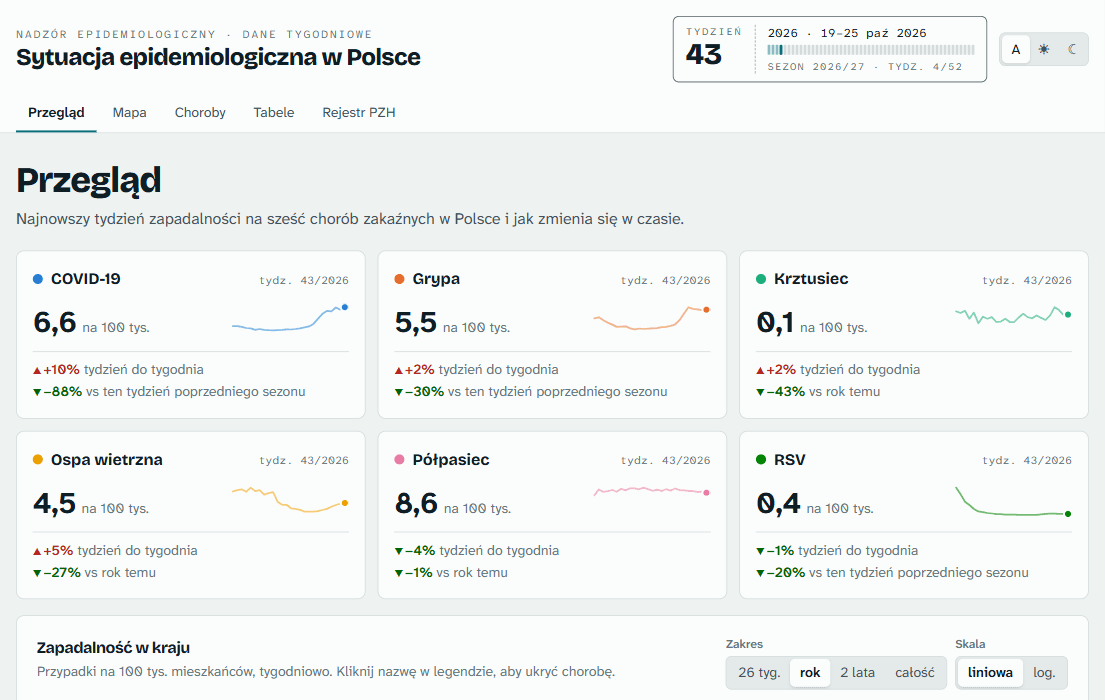
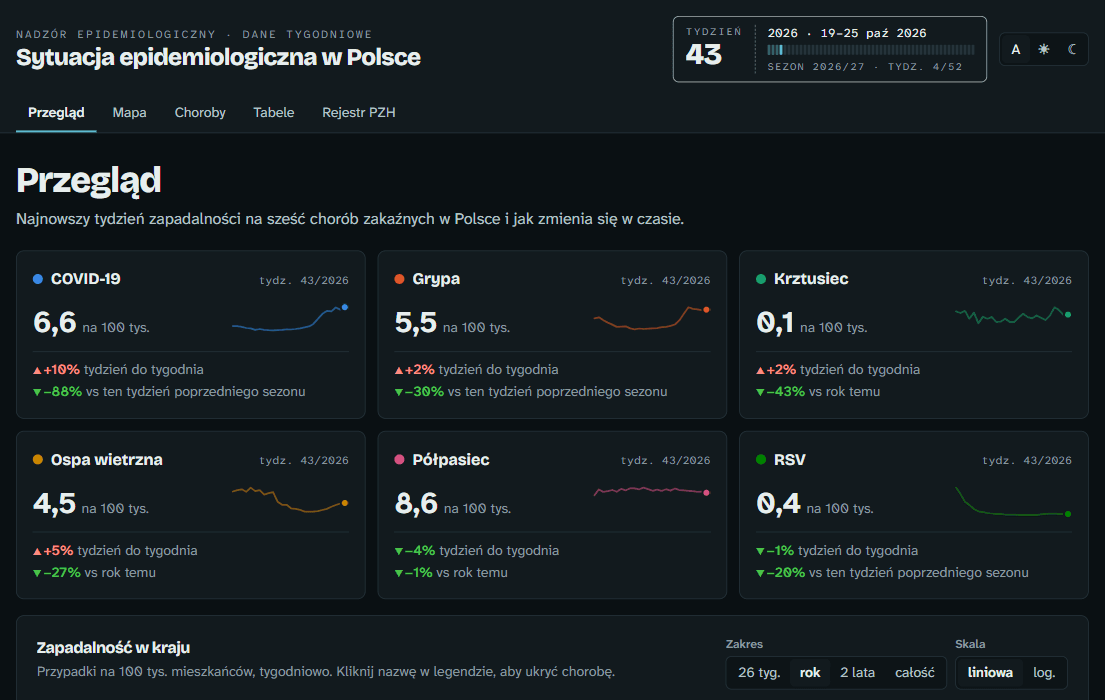
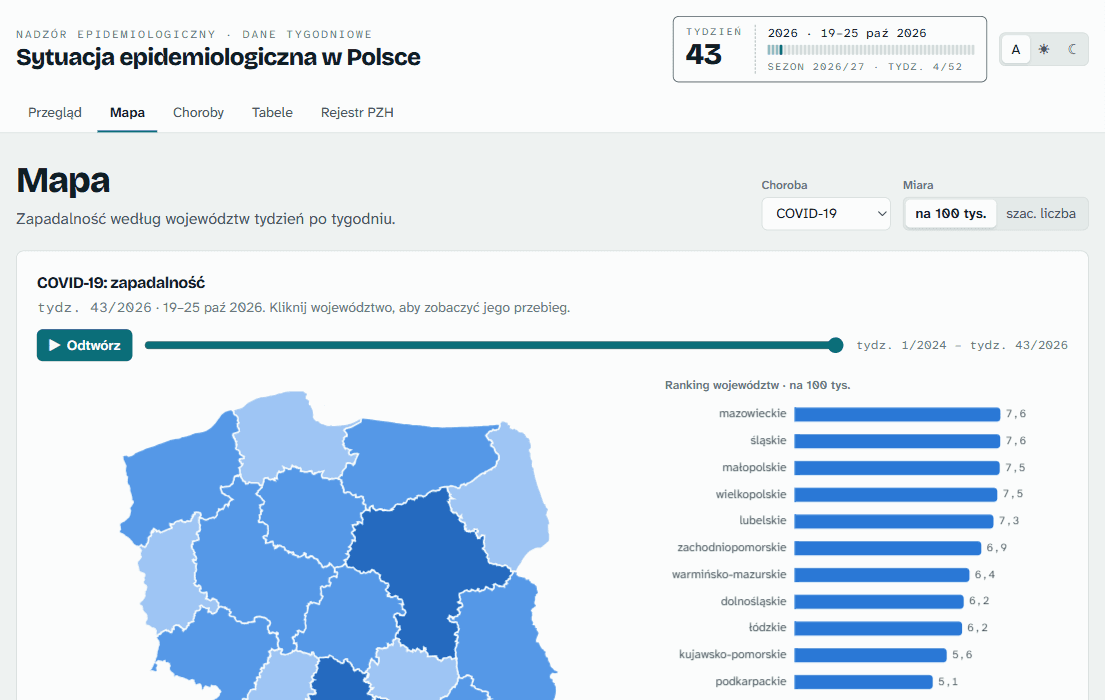
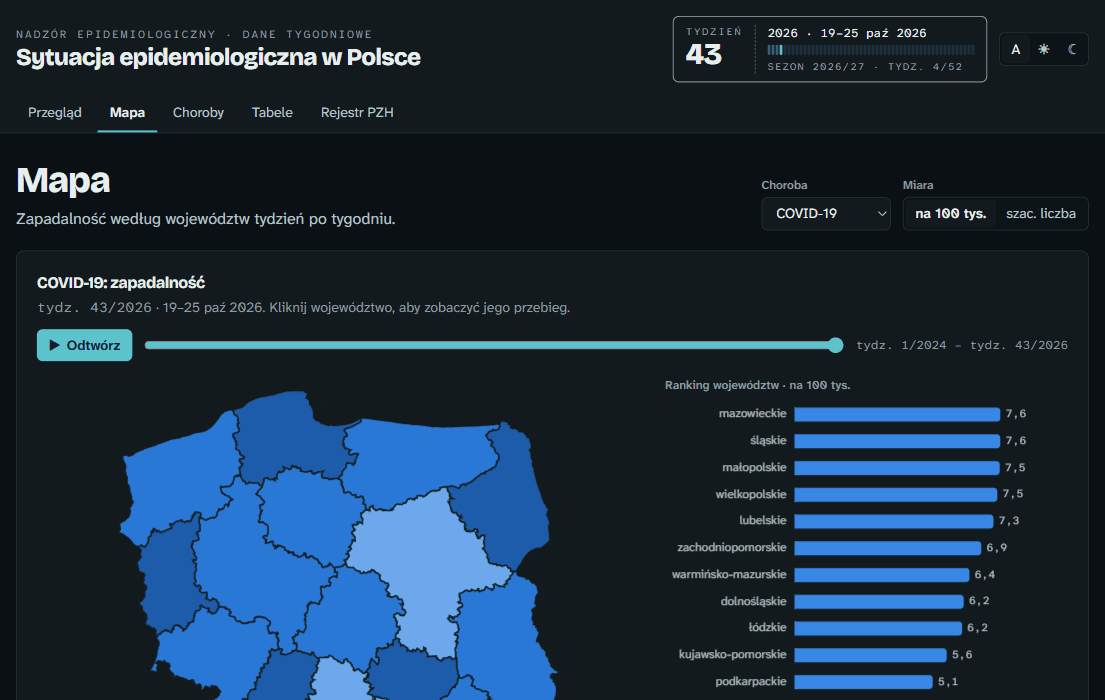
What real data changed
Off-season maps looked empty. Scaling colours to the all-time peak washed out quiet weeks, so the map now scales its colours per season.
Long history made charts unreadable. Half-monthly bars going back to 2012 now default to three years, with a range control. Annual tables reaching back to 1999 produced 108 columns, so that heatmap shows the last ten years.
Where it is now
It is live at epi-poland.vercel.app and has 173 automated tests.
React 19, TypeScript, ECharts, TanStack Table, GitHub Actions